The rate of injection (ROI) for Spray H resembles a “square-wave” or “top-hat” profile, but realistic ramp-up and ramp-down features for its actual ROI must be considered when attempting to model the experiment. This section discusses issues with the measured ROI and provides recommendations (and file download) for the ROI to be used for spray modeling.
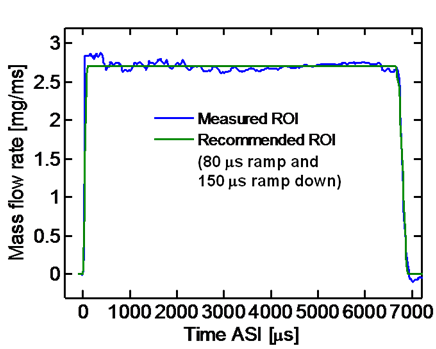
Unfortunately, time response limitations and other measurement artifacts yield inaccurate ROI measurements during the initial startup transient. The measured ROI (average of 60 injections) for Spray H is shown at the left. For momentum-based measurements, a force sensor is placed a finite distance from the injector (example), and the spike at the beginning of injection may be an artifact of mass accumulation at the head of the spray, as discussed in more detail. Oscillations during the main period of injection may be real, and caused by pressure fluctuations, for example. However, sensor vibration or ringing at a natural frequency should also be considered. As a result, caution should be exercised when using measured ROI compared to an experiment, particularly for comparison of initial penetration. A recommended rate of injection shape that removes noise and contains a more realistic ramp-up shape is also shown on the figure. (Download the “recommended” and measured Spray H rate of injection.)
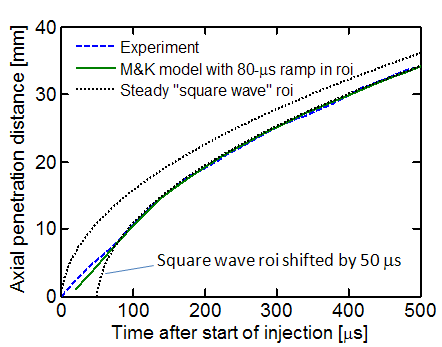
An example showing how the ramp-up shape affects penetration is given at the figure at left. Measured Spray H vapor penetration with 0% ambient oxygen (condition and data) is compared to model predictions from the Musculus and Kattke control-volume model. Comparison are made for a “square-wave” or “top-hat” ROI that immediately reaches its steady value and the recommended variable ROI shape with an 80-µs ramp-up shape. The penetration of the 80-µs ramp-up shape is a much better match to the experimental data, although even this could be improved with further iteration on the rate of injection. The square-wave-ROI penetration prediction, shifted by 50-µs in time, is also a decent match suggesting an “effective” lag as the injector opens. The 50-µs-shifted steady solution and the 80-µs ramp-up are practically indistinguishable after about 100 µs ASI, and each closely matches the experiment. Although shifting the steady solution to account for this injector lag may be performed (Naber, 1996), this shift incorrectly assumes a steady ROI solution. More realistic ramp-up shapes should be implemented to provide better understanding of the spray development (Payri, 2008).