Details of the Thermal Distribution in the Combustion Vessel for Spray A
Figure 2.3.1.1 shows the average gas temperature at various positions in the “core” region of the vessel, relative to predictions based on a single relationship between Tcore and Tbulk (i.e., using only the measured pressure to predict Tcore). Along the axis of the spray, the gas temperature is uniform within 1%, except for a measurement point in the boundary layer only 1 mm in front of the injector tip. Temperature is also uniform along the same horizontal plane (y = 0, z = ±15 mm) outside of the spray. The most significant variation is in the vertical direction (y = ±15 mm, z = 0) where the temperature varies by ± 4% for a vertical change of ± 15 mm. This vertical stratification is obviously caused by buoyancy effects. Please see Meijer 2012 for more details.
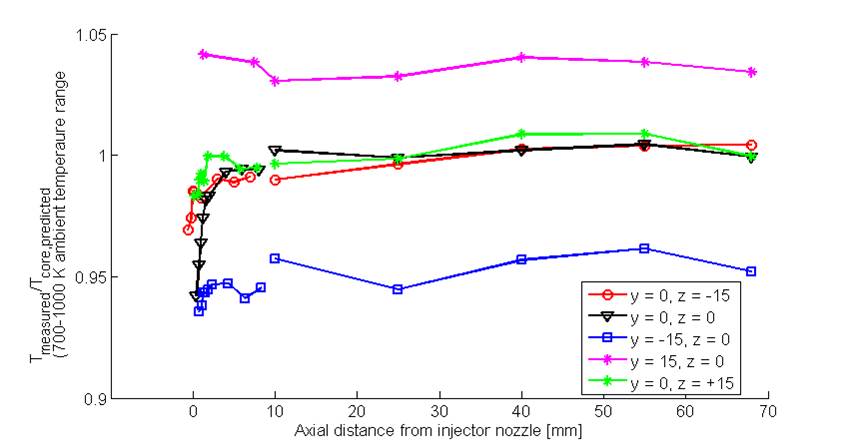
Figure 2.3.1.1 Average gas temperature in the “core” region of the combustion vessel at Spray A conditions, 0% O2
Schlieren and broadband chemiluminescence movies of the premixed combustion and cool down processes, along with temperature measurements throughout these events, are described in Pickett SAE 2010-01-2106 and Maes 2022. Rayleigh scattering experiments and thermocouple measurements at various distances close to the nozzle have been carried out in Maes 2022. 3D temperature profiles have been generated for different target temperatures (see image below for 900K). Such profiles can be used to initialize numerical simulations as demonstrated in Maes 2022.
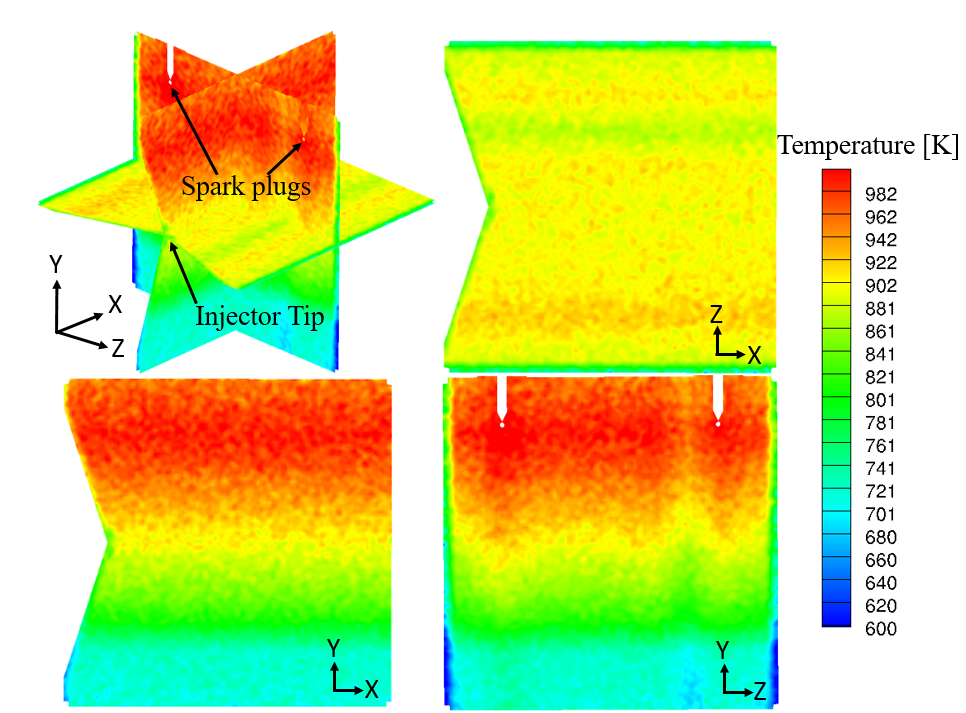 Temperature Profile for 900 K