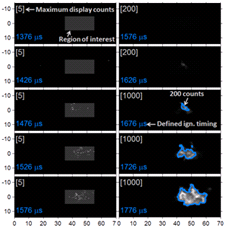
Fig. Line of sight chemiluminescence images with high-temperature reactivity borders shown in (blue). 750 K, 22.8 kg/m3. Relative image counts for display range is in brackets []. CMOS camera with f/1.2 collection, <600 nm filtering, 46 μs frame exposure time. [1]
The onset of high-temperature heat release in the spray can be characterized by high-speed chemiluminescence imaging to directly measure the location and timing of ignition. Schlieren imaging can also be used to identify high-temperature ignition, but the visual changes in the schlieren effect are difficult to post process. As a Spray A standard, we therefore choose to define ignition relative to high-temperature chemiluminescence. A light-based method is needed because some devices are open systems at constant pressure. In addition, pressure-based methods require correction for the speed of sound to the transducer as described in [1 , 2].
The first step in the process is discover the intensity of high-temperature chemiluminescence in your imaging system, paying attention to the fact that high-temperature chemiluminescence intensity is orders of magnitude different than soot luminosity or first-stage, cool-flame chemiluminescence. An example is given for the figure at the right, which is a condition with an extended ignition delay and no soot formation. The sequence begins prior to heat-release and ends shortly after ignition. The maximum display count shown in brackets, which affects the visible intensity range of the image, is adjusted throughout the sequence. A region of interest for special consideration is also shown as a gray box.
Notice that prior to 1476 μs there is no visible luminosity on a 0-5 display count range scale. From 1476-1576 μs very weak chemiluminescence is detectable in the region of interest indicated. This emission is low-temperature, or cool-flame, chemiluminescence, and it is only visible because of the low display range. By adjusting the display range, one sees that strong chemiluminescence begins after 1600 μs. A weak signal appears at 1626 μs that grows in intensity with peak values near 1000 counts. A luminosity threshold border of 200 counts is also drawn on the images. Intensities above 200 counts are exceeded starting at 1676 μs, which we will explain below is the defined ignition delay time.
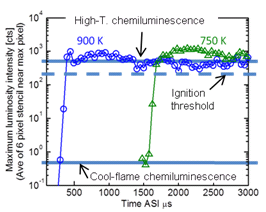
Fig. Maximum luminosity intensity for the 900 K and 750 K conditions as ignition occurs and combustion progresses [1]
The maximum luminosity intensity in the boxed region of interest is quantified with respect to time for both the 750 K and 900 K conditions in the next figure. Note that for the 900 K condition, the region of interest is shifted to be that near the lift-off length region, which corresponds to the ignition region and avoids the soot luminosity region downstream. The data points near a value of unity correspond to the cool-flame chemiluminescence, but consistent with the image sequence, the intensity increases by orders of magnitude and stabilizes below 1000 counts for either ambient temperature. The major intensity difference between the magnitude of cool-flame and high-temperature chemiluminescence is highlighted.
Having determined the intensity of the line-of-sight high-temperature chemiluminescence for this imaging system (step 1), a threshold sufficiently lower than this, and higher than the cool-flame levels, is chosen to define ignition. The standard is 50% of the high-temperature chemiluminescence level, which is chosen to be sufficiently above the noise floor and cool-flame chemiluminescence of the camera, but also sufficiently under the high-temperature chemiluminescence that can vary with respect to time. This definition resembles that of lift-off length, which is convenient because the same definition can be used to find the lift-off length position with respect to time.