Pressure records of the combustion vessel are used for heat-release-rate analysis of diesel combustion, including the ignition delay time. Pressure measurements were acquired using a piezoelectric pressure transducer located in a lower corner of the vessel, opposite the injector (see vessel geometry). The time-base of the pressure measurement was adjusted to account for a time-delay in the pressure measurement caused by the speed of sound and the distance between the ignition site and the pressure transducer (Higgins, 2000). In addition, corrections are made for heat transfer in the vessel during the time of injection.
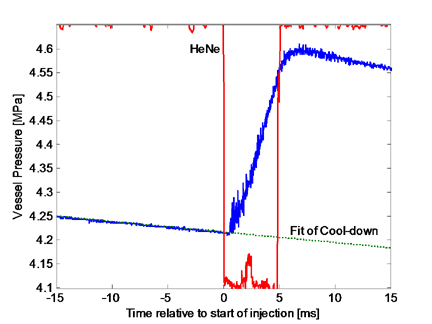
Fig. 4.9.1. Pressure history of vessel relative to the time of injection. HeNe laser intensity (7 mm in front of injector) shows injection timing. Ambient conditions at injection: Ta 1000 K, ρa 14.8 kg/m3, 21% O2. Injector conditions: 138 MPa, 0.18 mm nozzle, D2 fuel.
Figures 4.9.1 and 4.9.2 are shown to illustrate these corrections. Figure 4.9.1 shows the combustion vessel pressure relative to the start of diesel injection. The timing of the start and end of diesel injection was detected by measurement of a HeNe laser beam positioned 7 mm in front of the injector tip. The laser beam is attenuated during injection, as shown in Fig.4.9.1. The laser provides more sensitive feedback for the actual injection timing, than electronic inputs to the injector or a needle-lift sensor. The vessel pressure measurement shows that pressure is slowly decreasing in the chamber during the cool-down period prior to fuel injection. A curve fit of the pressure record prior to diesel injection is made to estimate how this cooling trend would affect interpretation of the pressure rise during diesel injection. The difference between the measured pressure and the cool-down curve fit is the pressure rise caused by diesel combustion, which is shown in Fig. 4.9.2. This procedure corrects for the natural cooling of the vessel, but it does not correct for changes in heat transfer caused by the spray after injection, such as jet-wall impingement.
The original pressure rise, as well as a pressure signal corrected for speed-of-sound delays and a smoothed pressure curve are shown in Fig. 4.9.2. The distance between the penetrating jet and the pressure transducer is used to make the speed-of-sound correction. Estimates for the jet penetration distance are obtained using the correlation developed by Naber and Siebers (Naber, 1996). The speed-of-sound correction shifts the pressure reading by approximately 0.1 ms near the time of ignition, bringing the pressure reading into alignment with the rise in luminosity in the vessel detected with a high-sensitivity photodiode. Note that with increasing time the jet penetrates all the way to the pressure transducer, making the speed-of-sound correction approach zero and the two pressure curves lie atop each other.
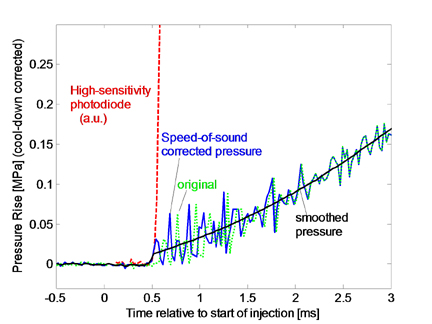
Fig. 4.9.2. Pressure trace from Fig. 4.9.1 after subtraction of cool-down fit and correction for speed-of-sound delay to the pressure transducer at the corner of the vessel. Speed-of-sound correction to pressure shows ignition time consistent with luminosity increase measured with a photodiode
The luminosity and corrected pressure curves show that time from the start of injection until the beginning of the premixed burn, or the ignition delay, is approximately 0.5 ms for Fig. 4.9.2. (Start of injection is shortly before the time when injection attenuates the HeNe laser positioned 7 mm in front of injector). This is the start of rapid pressure rise marking the beginning of second-stage high temperature chemistry, rather than first-stage ignition that precedes the premixed burn. First-stage ignition produces a much smaller pressure-rise (Higgins, 2000).
The intense pressure rise of the premixed burn creates pressure waves that propagate throughout the combustion vessel. The pressure waves are characterized by large oscillations in measured pressure after the time of the premixed burn. These oscillations are not experimental noise as the noise level of the pressure measurement prior to ignition is much smaller than the oscillation level. The frequency of these oscillations matches the resonant frequency of the combustion vessel. Typically, these pressure oscillations are smoothed in engine experiments by filtering of the signal in post-processing. A smoothed pressure curve, obtained by Fourier-filtering, is also shown in Fig. 4.9.2. The smoothed curve falls in the middle of the pressure oscillations after 0.5 ms. However, applying the same filtering parameters prior to 0.5 ms would over-smooth the pressure during the time of ignition. Therefore, a lower-order filter is used prior to ignition. A documented constant or manually chosen noise threshold on the smoothed pressure rise data defines the ignition delay time.
Pressure traces available to download in the ECN database are the raw pressure rise, the smoothed pressure rise (averaged over the number of injections), standard deviation, uncertainty, speed of sound corrected time after start of injection, absolute pressure, ROHR, and total heat release. Typically, there is approximately ±5% variation (5% rms) in ignition timing from injection to injection.