Details of the Composition in the Constant Volume Premixed Combustion Vessel
The procedure for simulating diesel experimental conditions is illustrated by a combustion vessel pressure history shown in Fig. 2.2.1 (pressure data). To begin the simulation procedure, the vessel is filled to a specified density with a premixed, combustible-gas mixture. This mixture is then ignited with spark plugs, creating a high-temperature, high-pressure environment through an initial premixed combustion. As the products of combustion cool over a relatively long time (~1 s) due to heat transfer to the vessel walls, the pressure slowly decreases. When the desired experimental conditions are reached, the diesel fuel injector opens and auto-ignition and combustion processes ensue as shown by the second pressure rise in Fig. 2.2.1 at 930 ms. The ambient gas temperature, density, and composition at injection are determined by the pressure at the time of fuel injection and the initial mass and composition of gas within the vessel.
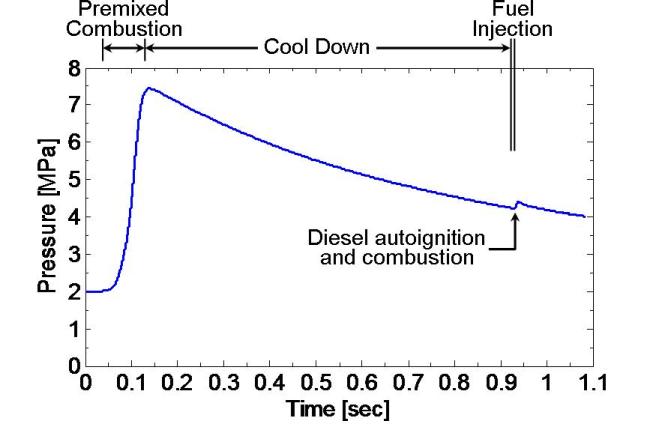 Fig. 2.2.1. Simulation to produce core ambient conditions of 1000 K, 14.8 kg/m3, 21% O2 at the time of diesel fuel injection
The preburn and cool down process is also visible in this movie (conditions 950 K, 14.8 kg/m3, 10% O2 and others as Fig. 2.2.1) showing the spark, chemiluminescence from combustion, and eventual diesel injection. During the cool down process, the fan becomes visible as it becomes hot and emits thermal radiation. Reflections from a laser beam passing near the injector tip are also visible at the left.
For Fig. 2.2.1, the ambient conditions were intended to simulate air (21% O2). The following reaction gives the reactant and product compositions of the premixed combustible gas mixture used to generate the high-pressure, high-temperature, 21%-O2 environment:
3.053·C2H2 + 0.509·H2 + 28.888·O2 + 69.33·N2 → 21.00·O2 + 69.33·N2 + 6.11·CO2 + 3.56·H2O (1)
The reactants consist of acetylene (C2H2), hydrogen (H2), oxygen (O2) and nitrogen (N2). The reaction is normalized to produce 100 moles of product and assumes that complete-combustion products are generated.
Other environments, such as exhaust-gas-recirculation use in engines, or an inert ambient (0% O2), were simulated by changing the reactant O2 and N2 concentrations. Table 2.2.1 shows the mole fraction and molecular weight of the reactants and products for a given ambient oxygen concentration. Like Eq. (1), the products listed in Table 2.2.1 are assumed to be complete-combustion products.
Table 2.2.1. Percentages of ambient gas at the time of diesel injection and reactants prior to spark ignition.
| Products (composition at diesel injection time) |
Reactants (prior to spark ignition) |
|||||||
|---|---|---|---|---|---|---|---|---|
| O2 | N2 | CO2 | H2O | MW | rC2H2 | rH2 | rO2 | rN2 |
| 21.00 | 69.33 | 6.11 | 3.56 | 29.47 | 3.00 | 0.50 | 28.38 | 68.12 |
| 20.00 | 70.30 | 6.13 | 3.57 | 29.43 | 3.01 | 0.50 | 27.42 | 69.07 |
| 19.00 | 71.27 | 6.15 | 3.58 | 29.40 | 3.02 | 0.50 | 26.46 | 70.02 |
| 18.00 | 72.24 | 6.17 | 3.59 | 29.36 | 3.03 | 0.50 | 25.50 | 70.97 |
| 17.00 | 73.21 | 6.19 | 3.60 | 29.32 | 3.04 | 0.50 | 24.54 | 71.92 |
| 16.00 | 74.18 | 6.21 | 3.61 | 29.28 | 3.05 | 0.50 | 23.59 | 72.87 |
| 15.00 | 75.15 | 6.23 | 3.62 | 29.24 | 3.06 | 0.50 | 22.63 | 73.82 |
| 14.00 | 76.12 | 6.24 | 3.63 | 29.21 | 3.07 | 0.50 | 21.67 | 74.77 |
| 13.00 | 77.09 | 6.26 | 3.64 | 29.17 | 3.08 | 0.50 | 20.71 | 75.72 |
| 12.00 | 78.06 | 6.28 | 3.65 | 29.13 | 3.09 | 0.50 | 19.75 | 76.67 |
| 11.00 | 79.04 | 6.30 | 3.66 | 29.09 | 3.10 | 0.50 | 18.79 | 77.61 |
| 10.00 | 80.01 | 6.32 | 3.67 | 29.06 | 3.10 | 0.50 | 17.83 | 78.56 |
| 9.00 | 80.98 | 6.34 | 3.68 | 29.02 | 3.11 | 0.50 | 16.87 | 79.51 |
| 8.00 | 81.95 | 6.36 | 3.69 | 28.98 | 3.12 | 0.50 | 15.91 | 80.46 |
| 7.00 | 82.92 | 6.38 | 3.70 | 28.94 | 3.13 | 0.50 | 14.96 | 81.41 |
| 6.00 | 83.89 | 6.40 | 3.71 | 28.91 | 3.14 | 0.50 | 14.00 | 82.36 |
| 5.00 | 84.86 | 6.42 | 3.72 | 28.87 | 3.15 | 0.50 | 13.04 | 83.31 |
| 4.00 | 85.83 | 6.44 | 3.73 | 28.83 | 3.16 | 0.50 | 12.08 | 84.26 |
| 3.00 | 86.80 | 6.46 | 3.74 | 28.79 | 3.17 | 0.50 | 11.12 | 85.21 |
| 2.00 | 87.77 | 6.48 | 3.75 | 28.75 | 3.18 | 0.50 | 10.17 | 86.15 |
| 1.00 | 88.74 | 6.50 | 3.76 | 28.72 | 3.19 | 0.50 | 9.21 | 87.10 |
| 0.00 | 89.71 | 6.52 | 3.77 | 28.68 | 3.20 | 0.50 | 8.25 | 88.05 |
To investigate the assumption of complete-combustion products in this simulation procedure, gas sampling of the exhaust from the combustion vessel (without diesel fuel injection) was performed and shows agreement with values given in Table 2.2.1. In addition, single-zone, closed-reactor (Senkin module of Chemkin) simulations were performed using detailed chemistry (52 species, GRI Mech. 3.0) to determine if other minor species are likely present at the time of diesel injection. The simulation was initialized using the above reactants and initial temperature and pressure of Fig. 2.2.1. The closed-reactor was held at constant-volume shortly before ignition and then changed to a slowly expanding volume to simulate the vessel cool-down process. Figure 2.2.2 shows temperature (top) and mole fraction of OH (middle) and all minor species (bottom) (all species except CO2, H2O, O2, and N2) during the cool down. Two different product-gas simulations are shown: 21% O2 and 0% O2. The closed-reactor predictions indicate that minor species mole fraction decreases as temperature decreases. For typical diesel conditions (800-1000 K), the OH mole fraction drops below 1 ppm and less than 0.02% of all combustion products are minor species—indicating that the product compositions given in Table 2.2.1 for major species are close approximations for boundary conditions at the time of diesel injection. Full Senkin results from Fig. 2.2.2 may be downloaded (0% results 21% results). (Note that the 0% O2 condition has higher peak temperatures (and pressures) because of the lower specific heat of the product mixture. This result is also observed experimentally.
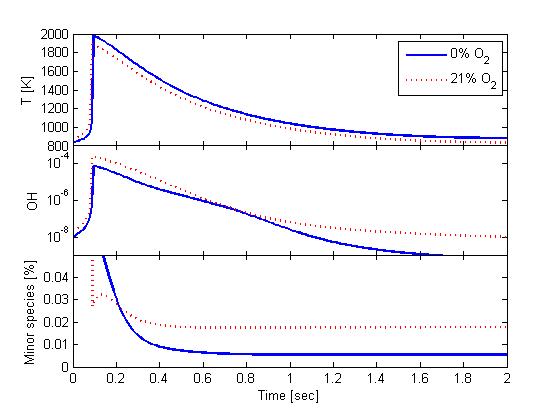
Figure 2.2.2
As shown in Fig. 2.2.1, the pressure rise caused by the diesel fuel injection is typically small relative to the premixed burn pressure rise. This is because of the large mass of ambient gas in the vessel relative to the mass of fuel injected. However, the pressure rise during the time of fuel injection does compress surrounding (unmixed) ambient gases, however, which increases the ambient temperature and density. Estimates for the change in ambient temperature can be made using isentropic compression, as performed to process lift-off length measurements obtained after the time of combustion. Therefore, two ambient temperatures may be given in the database: one before ignition and the other after ignition (Data Def.). For the conditions of Fig. 2.2.1, heat release from the diesel injection causes only a small change (less than 2%) in estimated ambient temperature. Conditions where the temperature rise is more significant include low ambient density (low mass in vessel) or large-nozzle, high-injection-pressure conditions (high mass of fuel injected).