Details of the Thermal Conditions in the Constant Volume Premixed Combustion Vessel
The thermal environment during the pressure decrease in the combustion vessel was measured with a fine wire (0.05 mm diameter) platinum/platinum-rhodium (type-R) thermocouple. As a thin-wire thermocouple, the time response of the thermocouple was adequate to measure the slow decay in temperature. The thermocouple reading was corrected for radiation errors and transient response to temperature changes (Heitor, 1993), but the corrections had little effect (<0.5% of mean) on the ambient temperatures of interest for diesel combustion (800-1200 K). This temperature range is well below that of combustion flame temperatures where radiation corrections are more of a concern.
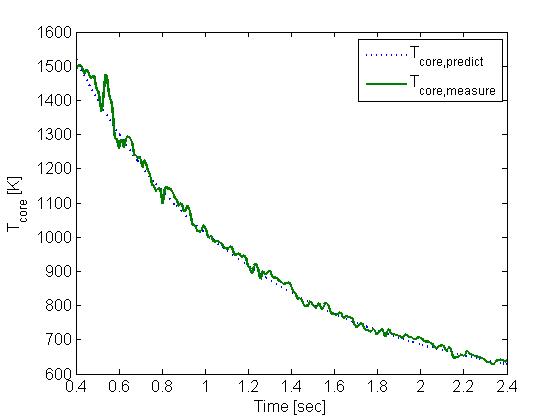
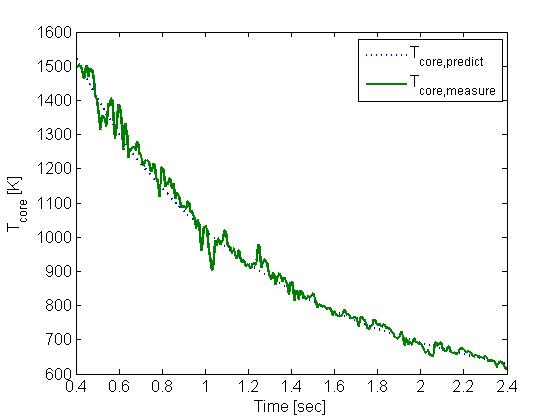
Figure 2.3.1
The measured temperature is shown as function of time in Fig. 2.3.1 for an ambient density of 14.8 kg/m3 and ambient oxygen concentration of 0%. The measurement position was at x = 20 mm, y = 0 mm, z = 0 mm, where x is axial distance, y is vertical cross-stream position (up or down), and z is horizontal cross-stream position (left or right), all relative to the injector wall. This location is in the “core” region of the vessel, defined as the initial location of gases that mix with the spray during injection. Temperature measurements are shown for two different cool-down events in the figure.
The measured core temperature is compared to a predicted average core temperature for the vessel. The predicted core temperature (Tc), which is the temperature reported as the ambient gas temperature for a given dataset (i.e. Ta), is obtained by first calculating the mass-averaged bulk temperature (Tb). The bulk temperature is determined from the real-gas equation of state (P = Z·R·ρb·Tb /MW) using the measured pressure and initial mass-averaged bulk density (bulk density is constant for an experiment), and the molecular weight (MW) and compressibility factor (Z) of the ambient gas. Z varies from 1.0 to 1.05 for conditions experienced in the combustion vessel. Note that the core temperature is higher than the bulk temperature because cooler, higher density gases exist in boundary layers of the vessel. This point is often overlooked in engine or combustion vessel experiments. A related point is that the core density is lower than bulk density. For comparison, bulk temperatures and densities are therefore also included in the database (i.e. TBulk).
A simple relationship, considering the cooler vessel wall temperature (Tw), is used to relateTb toTc , as shown in Eq. (2):
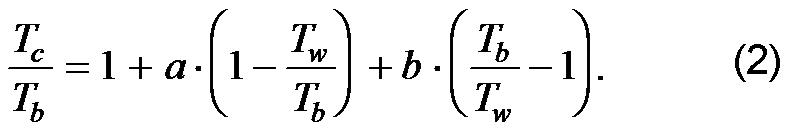
The second term on the right accounts for cooler, higher density gases in the boundary layers and the third term on the right accounts for cooler, higher density gases in the crevices and corners of the vessel. Values for a and b were determined from an empirical fit to the average measured temperature for many cool-down events at a given ambient gas density. For the ambient density of Fig. 2.3.1 (14.8 kg/m3), Tc/Tb ranges from a value of 1.05 at 1300 K, to 1.02 at 700 K. Figure 2.3.1 shows that local gas temperature, measured with a thermocouple at a single location, fluctuates about the predicted core temperature during the cool-down process. In addition, the magnitude of the temperature fluctuations may change from one simulation to the next at a given time in the cool down. Raw data for 10 different cool-down processes at these same conditions may be downloaded for more detailed analysis of the temperature history, including relevant time (or length) scales.
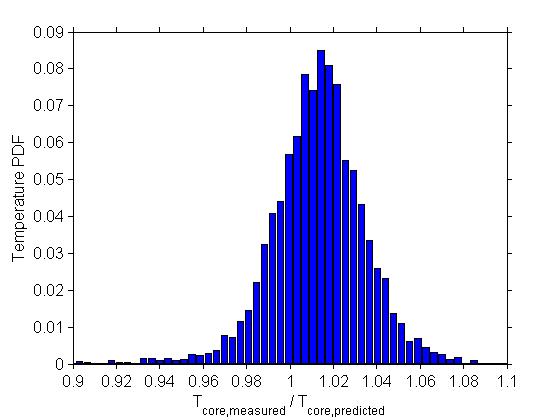
Figure 2.3.2
The temperature fluctuations are the result of time-dependent differences in the initial combustion process as well as heat transfer processes during the cool down event as the fan stirs the contents of the vessel—temperature variations are therefore expected. The magnitude of the temperature variation is shown in the histogram of the measured temperature normalized by the predicted temperature (Fig. 2.3.2, download data). The histogram is for instantaneous temperature measurements from 10 cool-down events for predicted core temperatures ranging from 700-1300 K. The histogram is based on core temperature, rather than time, to give equal weighting for each temperature. The histogram reflects a normal distribution with a standard deviation (σ) of 2.1% of the mean. Related to the normal distribution, 70% of the measured temperatures are within ±2.1% of the mean (±σ) and 95% of the measured temperatures are within ±4.2% of the mean (±2σ). These temperature fluctuations are one likely explanation for any variation in system performance from injection to injection.
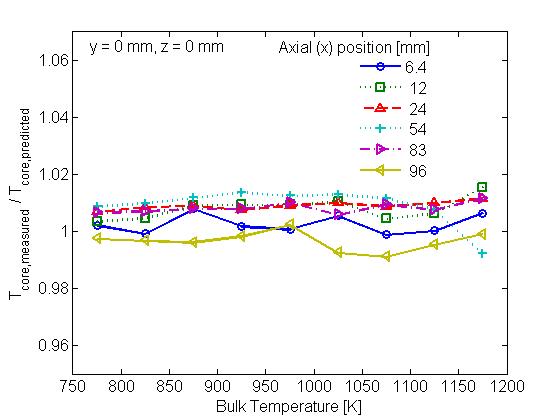
Figure 2.3.3
For this particular measurement station and density, the measured mean temperature is 1% higher than the predicted core temperature. However, there is some variation in mean temperature for different combustion vessel locations. The normalized measured temperature along the spray axis (y = 0, z = 0) before injection is shown in Fig. 2.3.3 (download data) for six different axial positions for an ambient gas density of 20 kg/m3. The mean temperature from 40 cool-down events is plotted against bulk temperature. The measurements show that the mean temperature varies by ± 1% along the axis of the spray, with slightly cooler regions near the injector or back walls. The ratio of predicted core temperature to measured temperature also changes by less than ± 1%. Temperature measurements outside of the spray axis are shown in Fig. 2.3.4 (download data). There is little change in temperature to the right, left, or along the x-axis direction, except near the vessel wall. The most significant variation is in the vertical direction where the temperature varies by ± 2% for a vertical change of ± 25 mm. Note, however, that sprays typically spread less than ± 15 mm from the spray axis over the length of the vessel so the vertical temperature variation may be less significant. Moreover, systematic combustion asymmetries in the vertical direction (i.e. ignition site, or lift-off length) have not been found.
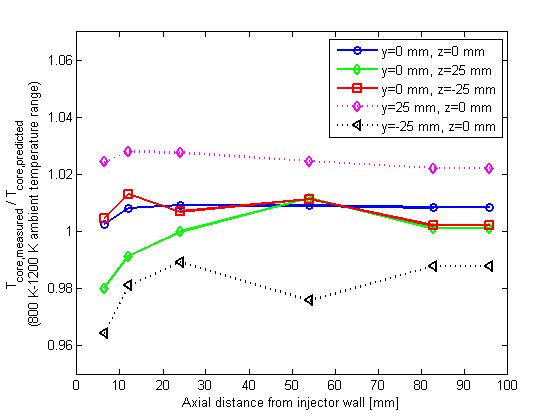
Figure 2.3.4
In summary, a large core region exists in the combustion vessel where mean temperatures are uniform for an extensive range of ambient temperatures. Instantaneous fluctuations in temperature (shown Fig. 2.3.1) do exist, however, and are likely to affect the diesel combustion process, as well as injection-to-injection variability.