The rate of injection (ROI) for Spray A resembles a “square-wave” or “top-hat” profile, but realistic ramp-up and ramp-down features for its actual ROI must be considered when attempting to model the experiment. Unfortunately, time response limitations and other measurement artifacts yield inaccurate ROI measurements during the initial startup transient.
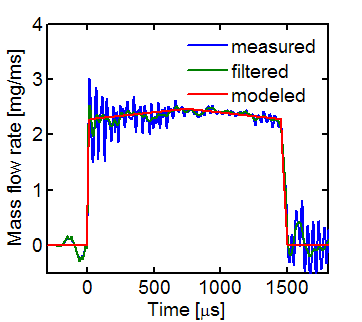
The measured ROI for Spray A injector 210677 is shown at the left. The blue is the ensemble-average of 50 injections, but despite the averaging, consistent oscillations persist. For momentum-based measurements, a force sensor is placed a finite distance from the injector (example), and the spike at the beginning of injection and oscillations thereafter may be an artifact of mass accumulation at the head of the spray, as discussed in more detail. Oscillations during the main period of injection may be real, and caused by pressure fluctuations, for example. However, sensor vibration or ringing at a natural frequency should also be considered. Similar problems exist for Bosch tube-type ROI instrumentation where the liquid is injected into a liquid. As a result, caution should be exercised when using measured ROI compared to an experiment, particularly for comparison of initial penetration. A recommended rate of injection shape that removes noise and contains a more realistic ramp-up shape is also shown on the figure. CMT has extended this analysis by providing a “modeling-recommended” Spray A virtual rate of injection. Please apply this CMT utility to generate the rate of injection for CFD modeling. Use the measured discharge coefficient, area-contraction coefficient (available here) and fuel density corresponding to the particular ECN injector and operating condition.
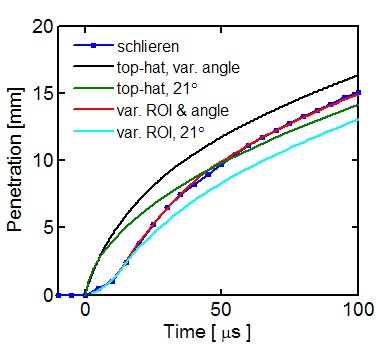
An example showing how the ramp-up shape affects penetration is given at the left. Measured Spray A vapor penetration (by schlieren) with 0% ambient oxygen (condition and data) is compared to model predictions from the Musculus and Kattke control-volume model with different prescribed spreading angles. Comparison are made for a “square-wave” or “top-hat” ROI that immediately reaches its steady value and the recommended variable ROI shape with only a 20-µs ramp-up shape. The penetration of the realistic ramp-up shape is a much better match to the experimental data during the early transient. See similar conclusions for the Spray H injector, which has a longer ramp-up shape.