Accessory data regarding liquid penetration and extinction at Spray A conditions.
0% ambient oxygen and 1.5 ms injection duration. Injector 210677 Sandia.
Liquid length is now defined based upon projected liquid volume. Liquid length data for Spray A using a projected liquid volume definition is available for nozzle 370 at this site.
|
Time-resolved liquid penetration via Mie scatter |
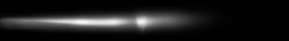
Time-averaged Mie-scatter image |
| File: Click on image to access data/image |
 |
 |
| Description |
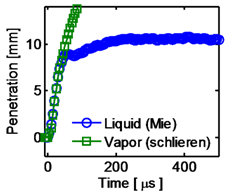
Time-resolved liquid length determined from high-speed Mie-scatter imaging using a 3% threshold of maximum intensity as recommended by Siebers. Mean liquid length for the steady period between 0.5 to 1.4 ms is 10.0 mm using this criteria. Dataset shows mean, standard deviation, and uncertainty for an ensemble-average of 20 injections. See Pickett, 2015 for a summary of the problems associated with Mie-scatter lighting. |
PNG image is the time-average for the steady period between 0.5 to 1.4 ms. Axial and radial profiles may be extracted from this image using “save link as” and image scaling information. Interpret with caution because of non-uniform lighting and light extinction. Image setup for high-speed movies found here for Mie scatter 183. Light enters from the bottom. |
| Image information |
See high-speed movies for optical setup. |
16 bit PNG image. Nozzle origin: column 1, row 20. Scale 20.52 pixels/mm. |
| References |
Pickett, 2010; Pickett, 2015 |
Pickett, 2015 |
| Additional information |
Please see Spray A standard for liquid length measurement for description of the preferred setup and measurement issues, as well as ECN2 proceedings and Manin, 2012. The time-resolved liquid length determined from Mie scatter may be compared to that processed using diffused back illumination as described in the third column. Use text file of maximum liquid penetration vs time from DBI imaging. Also see comparisons in Pickett, 2013. |
Instantaneous liquid borders from Mie-scatter imaging are are saved in Matlab format and are available to download . Load files within Matlab to access variables. See readme notes for more information. |
|
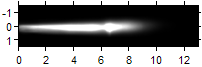
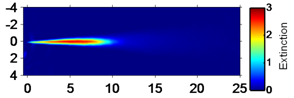
Diffused back illumination extinction |
HeNe laser extinction (centerline) |
| File: Click on image to access data/image |
2D optical thickness (τ) zipped .csv files
|
 |
| Description |
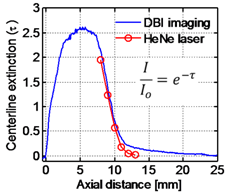
Line-of-sight optical thickness (τ where I/I0 = -exp(τ)) extinction data are averaged during the steady period between 0.5 to 1.4 ms. Axial and radial profiles are available using the .csv files above. Image setup for high-speed diffused back illumination 302 is here. Please be aware that beam-steering effects in the vapor phase may contribute to erroneous liquid extinction as discussed in Manin, 2012. For example, vapor-phase beam steering (interpreted as extinction) persists downstream of the liquid length at 15 mm. |
Text file of axial distance and centerline optical thickness (τ). Time-averaged optical thickness (τ) during the steady period of injection from a 0.5 mm HeNe laser (633 nm) passing through the centerline of the spray (Pickett, 2015). Collection is made with 220 mrad angle to account for vapor-phase beam steering, which persists in the DBI setup as discussed in Manin, 2012. |
| Image information |
Light source is 460 nm. Axial (x) and radial (y) pixel resolution is 10.5 pixels mm. These coordinates are included in the zip file. |
None |
| References |
Manin, 2012; Pickett, 2015 |
Pickett, 2015; Manin, 2012 |
| Additional information |
Instantaneous liquid borders from DBI imaging are are saved in Matlab format and are available to download . Liquid boundary is processed at an optical thickness of 0.6, which targets the optical thickness at the traditional Mie-scatter Siebers threshold (3% of maximum), while also accounting for 0.2-0.3 optical thickness units due to vapor beam steering contribution. See discussion of beam steering and liquid extinction at liquid length in Pickett, 2015. Load files within Matlab to access variables. See readme notes for more information. |
– |